If you want to speed up your website then Google PageSpeed Insights is an invaluable tool. It allows you to analyze and fix your website’s speed issues.
If your website suffers from slow loading speeds, you are going to miss out big time. It doesn’t matter how good your website is, what kind of content you have, or how many backlinks you own. With the age of high-speed connections, people aren’t willing to wait around while your page loads.
Most viewers recently reported they are only willing to wait around 3 to 5 seconds for a website to fully load. That’s not very much time before a potential visitor will bounce on to the next website! Almost the blink of an eye. Have you evaluated the performance of your site lately?
Many business owners are missing out on customers due to their slow-loading website. Do you know if your website loads slowly according to the standards? These are all things you can discover with Google PageSpeed Insights.
What is Google PageSpeed Insights?
The great thing about Google is it provides its customers with a variety of analytical tools. One of these tools is Google PageSpeed Insights. As you may be able to guess, this is a tool that rates the overall speed of your website. It does this by taking various data and analyzing it, scoring, and rating it where to improve.
The beauty of the tool is that once you use it, you’ll be able to learn where your website is lacking and where it excels. Simply put, you’ll know where to make improvements. The next problems will be figuring out what improvements to make and how to go about making them. That’s exactly what this guide can help with.
How does Google PageSpeed Insights work?
You learned above that this unique tool works by analyzing, scoring, and rating the speed of your website. Expanding on this a bit more will better help you understand the tool and how to use it. What you need to know above all else is that PageSpeed Insights does two general things. It first analyzes the loading speed of your page. The second thing it does is it compares that data to an average of previously analyzed pages.
When you type your URL into the tool, you are getting a reading of two basic things. It is also important to note that this data is averaged for both mobile and desktop users. This applies if you designed your website for mobile browsing. If not, that’s a whole different ball game, which you will want to research more.
Analyzing loading time
The first thing that the Google PageSpeed Insights tool measures are the loading speeds of your website. It also measures the resources it uses to deliver data. For instance, your website uses plugins, code scripts, imagines, and tons of resources. All of these resources must communicate to deliver the content your customers see. Some of these resources may naturally take longer to load than others.
Comparing the data
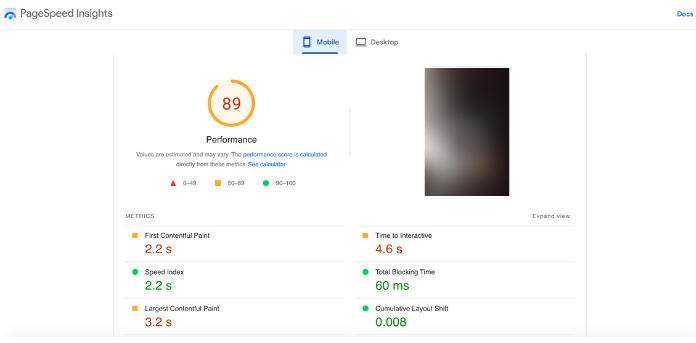
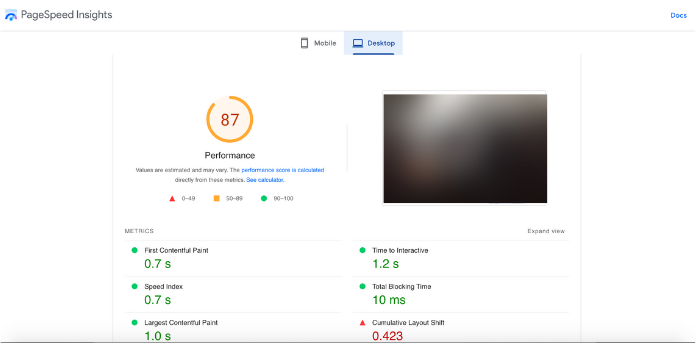
The next and most crucial thing the tool does is, compares the data it just collected. It then averages that data out and that’s how you get your rating. When the test is complete, you will see several bits of information. Understanding and learning to read that information will be key to utilizing the tool to the fullest.
The information provided will be:
- The average loading time of your website (This is for both desktop and mobile users)
- There will be an overall final page speed score
- Finally, you will receive a list of suggestions to show you where to make improvements
When you receive your ratings, you will see them on a grading scale of 0 to 100. Just like what you would receive in school. Here is a general example of the ranking system:
80 to 100 – Anything in this range is a great score
60 to 79 – This range is an average score
0 to 59 – Anything in this range is the lowest of the low, and you should fix it ASAP

There will be two results, one for mobile and one for desktop. This is because websites act differently depending on the device that you are using to view them. Because of this, you’ll need to work on both versions of your website.
There will also be a list of recommendations reported alongside these numerical rankings. This is crucial information you need to pay attention to, as it will show you where to make improvements.
Why does Google PageSpeed Insights matter?
The reason that Google PageSpeed Insights is so important is simple. It comes down to search engine ranking. You know that most people only visit the websites that come up on the first or second page of the search results. Often, it is the number one ranked site that they visit first.

Google utilizes a variety of tools and methods to figure out its SERP rankings. But we know that they rely heavily on PageSpeed metrics. Improving your PageSpeed score will likely result in a rise in your Google ranking. This becomes especially true if your starting point is not on the first page. Unfortunately, there is also a downside.
A poor PageSpeed score is likely to lower your rankings. Not to mention, many people will only wait a few seconds for your site to load. By now you can see the importance.
Google PageSpeed Insights is quick and relatively easy to use. After learning to read and correct the results, you will be able to improve your site speed.
PageSpeed Insights is not a tool that requires weeks or months of traffic monitoring. It provides you near-instantaneous results, so you can make improvements right away.
How to score 100% on GooglePage Insights
If you understand the importance of a high PageSpeed score, you also understand it will take work to fix.
It won’t be as simple as flipping a few switches. There are a lot of different aspects of your website that you’ll need to get right to have it working at its fastest.
This is where Google’s metric report comes in handy. The PageSpeed Insight results are the search engine telling you where to improve. The key is learning to read and rectify these error codes. Below, you’ll learn about some of the most commonly reported issues and how to fix them!
Defer offscreen images
Deferring offscreen images is commonly referred to as lazy loading. You are probably aware of the fact that images can be a real problem sometimes. They are unique and draw attention to specific areas, but they can be a real drag on the loading times. And that is exactly what is happening here. This message means that your offscreen images are slowing down your load times.
Offscreen images are the images that aren’t even on the initial screen that loads for your viewers to see. Websites load all images at once when they load. This is even true for images that aren’t viewed instantly. But don’t worry, you can change this. You can make it so that only the images your viewers look at load. And they will slightly load before the viewer scrolls to them, so you don’t have to worry about lag time here either.
There are several ways to go about fixing this issue. The most common is to use native lazy loading. Other options are using intersection observer API or applying javascript handlers. The latter two methods need some coding. The issue with the native lazy loading method is it only works in Chrome. So keep in mind that there are advantages and disadvantages to each method.
If you are using WordPress, then you have a few options. You can compress and minify images, use newer and faster image formats, and split the images into many pages. You can do this through the Autoptimize plugin.
Serve images in next-gen formats
If you are seeing this recommendation, it means that some of your images use older formats. You are probably familiar with the extensions .jpeg, .bmp, and .png.
These formats take longer to load because they aren’t compressed as well as some of today’s newer formats. The best way to fix this issue is by switching your images to the .webp format.
WebP has several advantages over its older alternatives. Almost all popular internet browsers support WebP format. It can also compress the image to almost half its original size. There are bulk WebP convertors you can download to make this an easy task. Or you could also use a javascript runtime environment convertor. The most well-known javascript runtime environment converter is Node.js.
Eliminate render-blocking resources
Think of this message as climbing a ladder or set of stairs. You must go one step at a time. A website works similarly when it is loading. The website might prioritize one section, making it load before the others load. Instead of steps or rungs on a ladder, this applies to static files and fonts like HTML, CDD, and JavaScript.
When a website reaches these files, it stops everything else it is currently doing and focuses solely on these resources. The problem here is, some of the files shouldn’t be prioritized before others. It honestly depends on the different characteristics of the website.
You want to ferret out the non-critical files and prioritize them to load second. The simple fix to this problem is to limit the amount of render-blocking resources you are using.
There are several ways to go about this. You can make some of the resources non-render blocking by deferring their download. Or you can bundle all the render-blocking resources using effective bundling techniques. There is also the option of reducing the size of these resources. Simply minify them so they require fewer bytes to load.
Certain images are only viewed in specific sizes. What happens when you take an image and expand it? It becomes blurry. If you expand it too far, it becomes so blurry it doesn’t render properly. That is virtually what is happening with some of your images.
This error message means that viewers’ browsers are wasting time resizing certain images.
The easiest and best way to fix this issue is by taking advantage of the Lighthouse app or one similar. It crawls the site for all the improperly sized images and renders them to their actual size.
Reduce unused CSS
In simple terms, every site will load CSS files. Unused CSS files are files that are needlessly loading. They are simply files loading when they don’t need to be loading, taking up valuable resources. When there are a lot of needless CSS files loading it can cause dramatic lag. By reducing the unused CSS, you can speed up your website.

Luckily, the fix for this is just as simple as the explanation. To fix this issue, you can use a plugin called Asset CleanUp. When you have the app installed, open the settings, and you should see a CSS and JS manager. Click on the manager and you will see a list of all your CSS and JS files. From here, you will be able to remove any CSS or JS files that are not needed.
Minify JavaScript and CSS
When you get this error report, it means that you need to optimize some of your CSS and JavaScript files. CSS and JavaScript codes are often written with spacing and other variables. This is to make the code more readable for the developers. While it makes the code more readable, it often slows load times.
To fix the issue you must remove the extra spacing and unneeded variables in the code. This is something that can get rather complicated and will likely require someone familiar with coding. There are some plugins available that can do this automatically. WP Rocket is available for WordPress.
Reduce initial server response time
Server response time is measured in TTFB (Time to first byte). It represents how many milliseconds go by before a viewer sends the request to load the page. It’s that initial time after the viewer clicks on the website or enters your URL in the browser. A response time of lower than 200 milliseconds is what you should aim for. Reducing your initial server response time is crucial to having a fast website.
To get fast response times, use a reliable and fast web hosting service. If this isn’t possible, you can try utilizing a CDN (Content delivery network). This is a network of proxy servers that spreads out data in the most efficient way possible.
Avoid an excessive DOM size
This error message means there are too many DOM nodes or HTML tags on your page. To avoid this message, don’t use poorly coded plugins or themes and page builders that generate bloated HTML code. You should also try not to copy and paste text in a WYSIWYG editor (what you see is what you get, ex. Webflow or Wix).
Enable text compression
This message means that your page contains CSS and JavaScripts that aren’t compressed. There are crawlers available that compress text-based resources into .gzip files. This type of file compression can increase speed by as much as 10 percent.
Avoid large layout shifts
A layout shift is when a piece of content is so big it shifts the position of the remaining content during loading. A drastic change in fonts and sizes throughout your content would be the perfect example of this. There are a few ways to correct this error code.
The first is by reconfiguring your image dimensions and selecting ad size in advance. You should avoid adding extra banners above existing content. And always use faux bold and italic fonts of the same size.
Minimize main-thread work
This error is primarily caused when the CSS coding or JavaScript is too long. Minify JS and Defer JS are two plugins that can help cut down on unnecessary coding. Otherwise, this is a problem that would require reading code. This error code is similar to the “Minify JavaScript and CSS” error code.
Reduce unused JavaScript
Unused JavaScript means that your site is loading JavaScript that isn’t necessary. This JavaScript is somewhere in the code. A common way to deal with this issue is by delaying JS resources until necessary. The other option is only loading them when necessary. It simply goes back to only loading the images when the viewer looks at them.

Google’s PageSpeed Insights tool will reveal where your site contains unused JavaScript.
Avoid chaining critical requests
The error message goes back to the loading sequence of your site. There is more than likely something wrong with the critical rendering path, causing resources to be utilized in the wrong order. You simply have unneeded things loading before what needs to load. The best way to fix this is by optimizing the critical resources of your site. Make sure that what needs to load, loads first. This helps to minimize the number of critical resources used as well.
Reduce JavaScript execution time
This message means there’s too much JavaScript being executed at one time. This makes your page load slower while hindering its performance. The best way to fix this issue is to defer and eliminate unused scripts. There are a variety of plugins available that can do this for you.
Efficiently encode images
In simple terms, this error message means you haven’t optimized your images for the fastest load times. The most efficient way to correct this issue is by making sure to size your images right. There is also the option of compressing the images if you want to go this route.
Serve static assets with an efficient cache policy
This error is likely occurring on your website because your cache expiration time is too short. When a viewer visits a website, that website should build-cache into their browser. That way, the next time they visit the site, it loads from this cache instead of from the server.
If you are using a CDN or cache plugin, youplugint the cache expiration time much higher than the default setting. This will give your site more time to build into the viewer’s cache.
Keep request counts low and transfer sizes small
A request describes the files required to render your webpage while the transfer describes the resources as a whole. The request counts are what needs to load before a viewer sees the site. The transfer sizes are all the resources on your page. The best way to start rectifying this issue is by optimizing your site’s images along with reducing the DOM size. Excessive page redirects could be causing this as well.
CSS sprites are good for combining images, as this will clear up this issue as well.
Conclusion
You should have all the tools to make your website pass Google PageSpeed Insight’s tests. It’s time to put this information to use! A faster website will help in several ways. You will retain more of your impatient visitors. It will also likely result in Google pushing your website out to more people in the SERPs.
To increase your Google PageSpeed Insights score, start taking action on these tips;
- Serve images in next-gen formats
- Properly size your images
- Reduce/minify unused CSS and Javascript
- Reduce your initial server response time
- Enable text compression
- Avoid large layout shifts
- Reduce unused Javascript with Autoptimize
- Reduce JavaScript execution Time
- Keep request counts low and transfer sizes small
For more information, check out the following guides:
Josiah Brown
Search engine ninja that specializes in website performance optimization. Josiah is a freelancer helping businesses in a variety of industries.
follow me :


Related Posts
SEO Basics 2023: 10 Ways To Improve Your SEO on Google
May 17, 2023
7 Hacks: How to Rank YouTube Videos Fast (2023 Update)
Apr 19, 2023
The Best SEO Tools Under $99 Per Month
Apr 05, 2023